

April Fool's Rally?
Dealers and retailers bought. Iran called it a lie. And tonight, Trump told you exactly what comes next.

 - Wikipedia")
The S&P 500 just ripped 3.6% in two sessions. The best back-to-back performance since the spring of 2025. Retail investors are flooding into calls. CNBC is running segments about whether the bull market is back. Cramer is telling you three ways the market flips if the war ends.
It’s not ending.
And the rally you just watched wasn’t driven by peace. It was driven by passive flows and dealer mechanics. Three distinct groups of forced buyers, none of which hold a view on geopolitics, collided on the last trading day of Q1 to produce a face-ripping squeeze that is now being sold to the public as a fundamental turning point.
It isn’t. Here’s why.
The lie that launched a thousand points
On April 1, Trump posted that Iran’s president “has just asked the United States of America for a CEASEFIRE.” Markets surged. The S&P added another 47 points. Oil dropped below $100 for the first time in weeks.
Within hours, Iran’s Foreign Ministry spokesperson Esmail Baghaei went on state television and called Trump’s claim “false and baseless.” The IRGC issued a separate statement declaring the Strait of Hormuz “firmly and decisively” under their control. Iran’s Foreign Minister Abbas Araghchi had told Al Jazeera the day before: “At present there is no negotiation. The trust level is at zero.”
This is not a new pattern. It is the fourth time in nine days that Trump has claimed diplomatic progress and Iran has denied it within hours.
The first and most flagrant episode hit on March 23. Roughly 6,200 oil futures contracts worth approximately $580 million traded in a single minute between 6:49 and 6:50 AM ET, nearly nine times normal volume. About $1.5 billion in S&P 500 futures were purchased simultaneously. Fifteen minutes later, at 7:04 AM, Trump posted on Truth Social about “GOOD AND PRODUCTIVE CONVERSATIONS” and a “COMPLETE AND TOTAL RESOLUTION OF OUR HOSTILITIES.” The S&P surged 240 points in six minutes. Iran denied it at 7:37 AM. The index gave back half the move by 8:00 AM.
Total swing: roughly $3 trillion in market capitalization over 56 minutes. The suspicious pre-announcement volume patterns have drawn attention from federal prosecutors in Manhattan, who met with Polymarket representatives after one trader reportedly earned approximately $1 million on Iran-related prediction bets with a 93% win rate. Paul Krugman called the pattern treason. Multiple members of Congress have called for formal investigations.
Iran’s parliament speaker Mohammad Bagher Ghalibaf has been remarkably direct about what he thinks is happening. He accused Trump of using “fake news to manipulate the financial and oil markets.” By March 30, Ghalibaf was posting what amounts to trading advice on X: “Pre-market so-called ‘news’ or ‘Truth’ is often just a setup for profit-taking. It’s a reverse indicator. Do the opposite: If they pump it, short it.”
When the speaker of a foreign parliament is publicly offering counter-trade advice against the President of the United States during an active war, something has gone structurally wrong with price discovery.
Tonight’s presser: the mask slipped
Then came tonight.
At 9 PM ET on April 1, Trump addressed the nation from the White House on the war’s trajectory. The market narrative heading into the speech was peace. De-escalation. Ceasefire imminent. The two-day rally was priced on exactly that assumption.
Here’s a summary of what was said:
Trump declared Iran’s military capabilities destroyed: navy gone, air force in ruins, most leaders dead, ability to launch missiles and drones curtailed. He stated core strategic objectives are close to completion, that the U.S. would finish the job “very fast,” and is on track to complete all of America’s military objectives “shortly, very shortly.”
Then the escalation language: the U.S. is going to hit them “extremely hard over the next two to three weeks.” He noted the U.S. could strike their oil, that America holds “all cards whereas they have none,” and that Iran “is truly no longer a threat.”
On energy, Trump called gas price increases short-term, blamed Iran’s attacks on tankers, and stated that American oil production will soon be “substantially higher.” He said the U.S. does not need oil from the Middle East, has not needed the Hormuz Strait, and when the conflict ends, the strait will open up naturally.
Buried near the end: “Meanwhile, discussions are ongoing.”
Read that sequence again. That is not the language of a president preparing to accept a ceasefire— it is the language of a president preparing to escalate. Hitting them “extremely hard over the next two to three weeks” is not a peace signal. Threatening to “strike their oil” is not de-escalation. Finishing the job “very fast” is not a wind-down.
The market rallied into this speech on the hope of peace and just got told, on national television, that the plan is to accelerate.
The passive entities that built this rally
Let’s talk about what actually moved the S&P 500 on March 31. Because it was not Trump’s ceasefire claims. It was three categories of forced, passive, non-discretionary buying that converged on a single session.
The JHEQX dealer squeeze through 6,475
The JPMorgan Hedged Equity Fund manages approximately $20.9 billion and runs the single largest systematic options structure in U.S. equity markets. Every quarter, it rolls a three-leg put-spread collar on the S&P 500, with each leg involving roughly 35,000 SPX contracts and notional exposure approaching $22.7 billion per leg.
The Q1 collar had its protective put struck at 6,475. When the S&P broke below that level on March 26 amid war escalation, the collar’s hedging dynamics inverted: dealers who were short the put had to sell futures as the index fell, turning what was supposed to be a mechanical floor into a trapdoor that accelerated the decline. By March 30, dealer delta exposure (DEX) had reached approximately negative $835 billion, the most extreme mechanical selling pressure of the entire war cycle.
On roll day, the old collar expired and JPMorgan established the new Q2 structure (estimated strikes: 5,210/6,180 put spread against a 6,865 short call, June expiration). Here is where the squeeze happened. As the index rallied off the morning lows and traversed back through 6,475 to the upside, gamma at that strike was extremely rapid on the last day of the quarter. Dealers who had been forced sellers below 6,475 became forced buyers above it. The gamma flip at the 6,475 strike swung from approximately negative $45 million to positive $42.8 million in a single session, an $87 million single-strike reversal. Simultaneously, the new collar’s placement supplied fresh volatility to the market, compressing implied vol, which triggered vanna-driven dealer buying (when vol drops, dealers buy back delta). This created a self-reinforcing feedback loop that powered the afternoon rip. DEX recovered 94% of five weeks of war-cycle damage in one afternoon.
That is not a vote of confidence in peace. That is what happens when the largest options structure in the market rolls on the last day of the quarter and the index happens to cross a critical gamma strike to the upside. It does not repeat until June.
The Q2 collar now maps the mechanical landscape for the next three months. The 6,180 long put becomes the new dealer floor: above it, dealers buy shallow dips mechanically. The 6,865 short call caps upside with increasing dealer selling pressure into any approach. And critically, a break below 6,180 would replicate the March 26 inversion, turning the floor back into a trapdoor.
CTA forced covering from the 99th percentile
Commodity Trading Advisors entered the war long equities. They exited it very, very short. Goldman Sachs estimated CTAs sold $184 billion of global equities over the prior month, flipping to roughly $47 billion net short globally and $18.4 billion short in U.S. equities specifically. UBS data showed CTA short exposure in S&P 500 futures hit the 99th percentile on a five-year basis. Nasdaq at the 97th. Russell at the 95th.
When Trump posted the ceasefire headline on March 31 and the JHEQX roll compressed vol simultaneously, CTA models hit their mechanical buy triggers. Goldman’s prime desk flagged systematic positioning as “approaching washed-out levels.” The asymmetry is extreme: in a sustained up tape, CTAs would need to buy $142 billion globally as models flip from short to long. In a sustained down tape, additional selling capacity is only $35 billion. The bearish bet is already fully expressed.
Key CTA trigger levels for the S&P 500: 6,756 (short-term), 6,745 (medium-term), 6,399 (long-term). The index closed at 6,575 on April 1. Still below the short-term and medium-term flip levels. A sustained move above 6,745 would force mechanical buying across the entire CTA complex. But the index has to get there first, and the JHEQX short call at 6,865 now caps the upside.
Goldman’s broader positioning data reinforces how extreme the setup was heading into the quarter-end. Global equities were net sold for six consecutive weeks, with shorts outnumbering longs 5.6 to 1. Gross hedge fund leverage hit 313.7% (five-year high) while net leverage fell to 71.3% (bottom decile). The Vol Panic Index sat at 9.2 out of 10, in panic territory for 17 straight sessions, one of the longest streaks in 15 years.
Pension rebalancing: $13.8 billion of forced buying
Goldman projected $13.8 billion in pension fund equity purchases for the Q1 end-of-quarter rebalancing, the 97th percentile of monthly flows tracked over three years. The largest rebalancing buy in years, driven by the war-induced ~5% equity decline during March pushing pension portfolios below their target allocations.
Much of the $13.8 billion concentrated into the final two trading days of March. This is not discretionary. It is not a view on the war. It is math. When equities drop and your mandate says 60/40, you buy equities to get back to target. Period.
Three categories of passive, forced, non-discretionary buyers. None of them care about Iran. All of them fired simultaneously on March 31. The collar won’t roll again until June. Pension rebalancing is done for the quarter. The first wave of CTA covering has passed.
What’s left is positioning, headlines, and a war that is about to enter its most dangerous phase.
The dead cat that thinks it can fly
OANDA’s senior macro strategist Kelvin Wong issued the most direct call: the rally was driven by short-covering and quarter-end positioning, not a sustainable bullish reversal. Only 24% of S&P 500 stocks trade above their 50-day moving average. Both the S&P and Nasdaq printed bearish engulfing patterns on their quarterly charts. The Dow’s 20-day moving average just crossed below its 200-day: a death cross.
Goldman’s oil shock history is the number that should keep you awake. Across four severe oil shocks (1974, 1980, 1990, 2022), the median peak-to-trough S&P 500 decline was 23%. The average was 27%. The mildest episode, the Iranian Revolution, still produced a 17% drawdown.
The S&P 500 has declined just 6.1% from its January all-time high near 7,000. Oil has surged 68% from pre-war levels. The Strait of Hormuz is handling 11 transits per day versus 138 pre-war. The IEA is calling it the largest supply disruption in the history of the global oil market. And the index has barely corrected.
Bear market rallies are historically violent and convincing. Goldman has identified 19 since 1980, averaging 44 days and 10-15% gains. All of them failed. During the dot-com bust there were 11 separate rallies of 5% or more within a total 49% decline. A 3.6% two-day bounce is noise by those standards.
The thinnest book in two years, and retail is all-in
Everything described above played out in a market with almost no depth.
Citadel Securities, the largest equity market maker in the world, published their April Capitulation Checklist on March 23. The liquidity data is stark. S&P 500 E-mini top-of-book depth sat in the 3rd percentile over the past two years. Investors could transact roughly $2.5 million at the touch versus a $12 million year-to-date average. That is back to Liberation Day levels from April 2025, when the S&P dropped 6% in a single session.
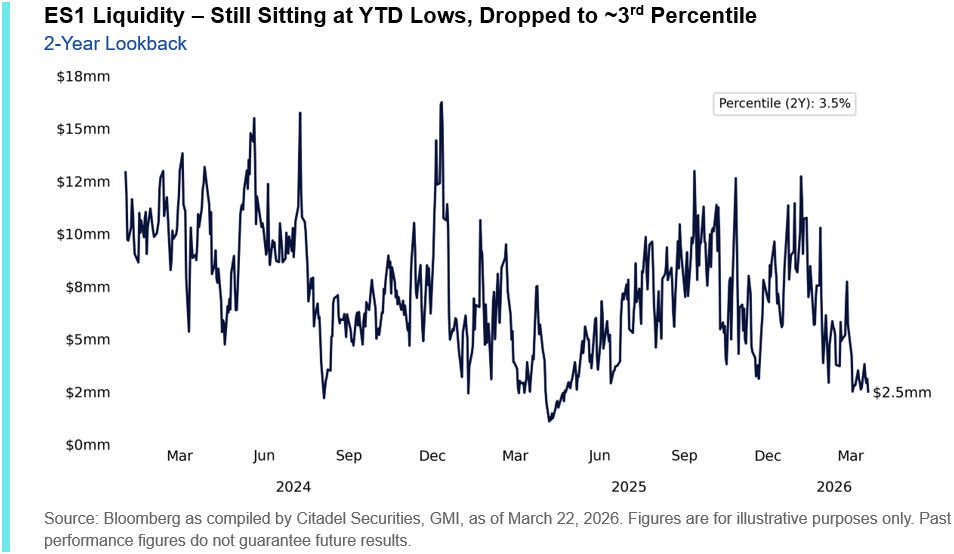
Think about what that means for the rally you just watched. A 2.91% move on March 31 happened in a market where the order book could absorb less than a quarter of its normal capacity at any given price level. The move was not a function of overwhelming demand. It was a function of overwhelming demand hitting an order book with no depth. The same mechanics that amplified the rally on the way up will amplify the selloff on the way down. Air pockets work in both directions.
ETF volumes have accounted for 35% or more of total equity trading for a record streak, peaking at 47%, a new five-year high. This is not broad-based participation. This is institutional hedging via ETF baskets while keeping core single-name exposures intact. It is synthetic short gamma: the end-of-day rebalancing flows from levered ETFs create mechanical volatility that compounds whatever directional move is already underway.
Now here’s the part that should concern you.
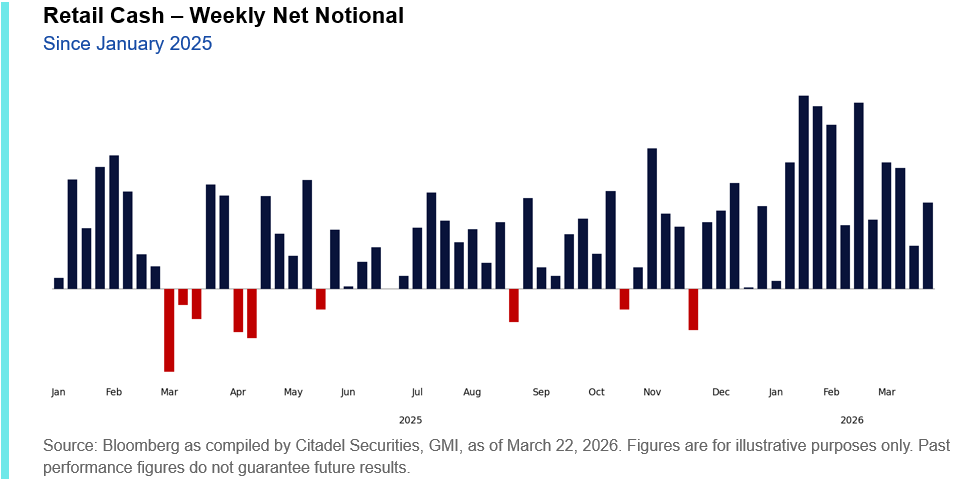
Retail investors have been net buyers of U.S. equities every single week since the end of November. Not most weeks. Every week. Through the entire war. Through the five consecutive losing weeks. Through the worst monthly decline in over three years. They kept buying.
Citadel’s own flow data shows January 2026 was the largest net buying month on record on their platform, going back to the meme stock era. February, despite the war starting on the 28th, still ranked as the fifth-largest net buying month ever. Average daily net notional on Citadel’s retail platform is running roughly 60% above last year, 25% above the prior peak in 2021, and double the 2020-2025 average.
The dip-buying intensity is accelerating, not fading. In February, retail net notional on S&P down days was 4.3x that of up days. In January it was 2.1x. Retail is not just buying the dip. They are concentrating their entire firepower on red days, convinced every selloff is a buying opportunity.
The vehicle of choice tells the story. Nearly 40% of all retail options volume on Citadel’s platform is now in zero-day-to-expiration contracts. Average daily retail options volume in 2026 is running 14% above 2025 and 47% above the 2020-2025 average. Retail options investors have been skewed better-to-buy in 41 of the last 42 weeks. This is not hedging. This is directional, leveraged, intraday speculation concentrated in the most convex and most perishable instruments available.
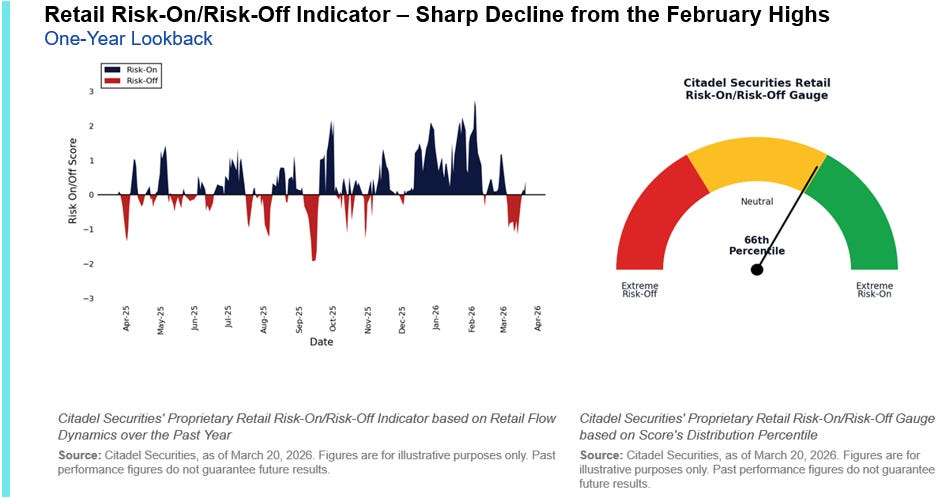
Meanwhile, sentiment surveys have collapsed. CNN Fear & Greed sits at 15, down 50 points from January. The AAII Bull/Bear Spread hit its lowest level in three months. Citadel’s own Retail RORO (Risk-On/Risk-Off) indicator has declined sharply from February highs.
Read that combination again. Retail sentiment is bearish. Retail positioning is aggressively long. They feel terrible about the market and they’re buying it anyway, reflexively, on every down tick, with 0DTE calls.
This is what getting trapped looks like. It does not feel like a trap at the time. It feels like discipline, conviction, buying when others are fearful. The problem is that “others” includes every institutional desk, every systematic fund, and every pension that just finished de-risking. Retail is the marginal buyer in a market where institutions have already left. And they’re buying into a 3rd-percentile liquidity book, two days before a long weekend, ahead of a deadline that could trigger a ground invasion.
Scott Rubner, Citadel Securities’ head of equity and equity derivatives strategy, summarized it precisely: “The conditions for a rally are very high, if geopolitical tensions ease, considering one of the largest short positions on US stocks that we’ve ever seen.” The operative word is IF. His capitulation checklist has not fully healed. The reflexive squeeze has created air pockets in both directions.
The market just rallied 3.6% on passive flows, fabricated diplomacy, and retail conviction into the thinnest order book in two years.
What happens when the headline flips?
Q2 levels: where gravity lives
The table below maps the key mechanical and technical levels for Q2, from the JHEQX collar boundaries to CTA triggers and our downside targets. Our premium models at QuantMap seek a potential monthly low of 6,120-6,180 on ES, which sits directly at the JHEQX Q2 long put strike and aligns with the lower bound of Goldman’s moderate correction scenario.
S&P 500 / ES Key Levels
~7,040 (0%) — January 28 intraday all-time high
6,865 (-1.9%) — JHEQX Q2 short call. Dealer ceiling. Increasing resistance into any approach.
6,756 (-3.5%) — CTA short-term buy trigger. Mechanical flip level.
6,745 (-3.6%) — CTA medium-term buy trigger.
6,700 (-4.3%) — Weekly resistance, trend reclaim level.
6,575 (-6.1%) — April 1 close. Current level.
6,475 (-7.5%) — Former JHEQX Q1 put strike. The rapid gamma level from the March 31 squeeze.
6,399 (-8.6%) — CTA long-term trigger.
6,300-6,350 (-9.3% to -10.0%) — Goldman moderate downside range. Key structural support.
► 6,120-6,180 (-11.7% to -12.6%) — QuantMap premium model monthly low target. JHEQX Q2 long put strike.
5,800-5,900 (-15.7% to -17.1%) — Mild oil shock analog (Iranian Revolution produced -17%).
5,400 (-22.9%) — Goldman severe shock scenario. Median historical oil shock drawdown.
Nasdaq 100 / NQ Key Levels
~26,180 (0%) — 52-week high / all-time high.
~24,800 (-5.3%) — Q2 mechanical resistance zone (proportional to ES 6,865).
~23,400 (-10.6%) — Current area (April 1).
22,500-22,800 (-12.9% to -14.1%) — Proportional moderate correction target.
► 21,500-22,000 (-16.0% to -17.9%) — Proportional to ES 6,120-6,180.
20,000-20,500 (-21.7% to -23.6%) — Mild oil shock analog.
18,500 (-29.3%) — Severe shock proportional target.
Dow Jones / YM and Russell 2000 / RTY
DJIA / YM: ATH ~49,000. April 1 close: 46,566. Correction target: 42,500-43,200 (-11.8% to -13.3%).
RUT / RTY: ATH ~2,680. April 1 close: 2,512. Correction target: 2,250-2,320 (-13.4% to -16.0%).
The critical observation: the JHEQX Q2 long put at 6,180 and our premium model target of 6,120-6,180 are effectively the same zone. Above 6,180, dealers mechanically buy dips. Below it, the hedging structure inverts and dealers become forced sellers, just as they were below 6,475 in late March. A break of 6,180 does not just represent a price level. It represents a regime change in market microstructure where the largest options overlay in the world flips from support to amplification.
The Easter weekend trap
Here’s where it gets real.
Good Friday is April 3. NYSE and Nasdaq close entirely. No overnight equity trading from 8 PM ET April 2 through the open on Monday, April 6. The March nonfarm payrolls report drops at 8:30 AM on April 3 while equity markets are shut. Gap risk is enormous.
April 6, Easter Monday, is Trump’s deadline for Iran to reopen the Strait of Hormuz. He has threatened to “completely obliterate” Kharg Island, Iran’s oil wells, and its power plants if the deadline passes.
The 31st Marine Expeditionary Unit (2,200-3,500 Marines purpose-built for amphibious assault) arrived in the CENTCOM area on March 27 aboard USS Tripoli. The 82nd Airborne is deploying. The USS George H.W. Bush carrier strike group left Norfolk on March 31. The Pentagon has been planning ground operations targeting Kharg Island, coastal sites near the Strait, and Iranian nuclear facilities. Former CENTCOM Commander General Frank McKenzie confirmed these plans have existed “for many years.”
Tonight, Trump said military objectives would be completed “shortly, very shortly.” He said the U.S. would hit Iran “extremely hard over the next two to three weeks.” He said they could “strike their oil.”
Now reread the timeline. Thursday’s close on April 2 is the last equity session before the Easter weekend. The April 6 Hormuz deadline hits on Monday. If escalation begins Friday night or over the weekend, when markets are closed and there is zero liquidity, Monday’s open could gap down violently.
The setup is textbook. Rally into a long weekend on passive flows and fabricated optimism. Retail buys the dip. Institutions have already de-risked. The headline drops when nobody can trade.
Scenario 1: Quick seizure, confirmed by Monday. Markets gap down on the invasion, then stabilize if it looks decisive. CTA triggers hold above 6,399. Range: 6,300-6,400 ES.
Scenario 2: Operation starts, gets messy. Iran retaliates with Fateh-series missiles from the mainland (15-20 miles from Kharg). Casualties mount over the weekend. Markets open Monday into a void. The 6,180 JHEQX floor breaks, dealer hedging inverts, mechanical selling compounds the move. Range: 6,100-6,180 ES initially, with risk of acceleration toward 5,800-5,900 if the conflict expands.
Scenario 3: No military action, another extension, more talk. Markets chop sideways with a slight positive drift. Possible, but increasingly difficult to square with tonight’s rhetoric and the force posture in theater.
A double-digit decline from the all-time highs is not a bear case. It is the barely-moderate case in a world where the largest oil supply disruption in history is ongoing, ground troops are positioned for amphibious assault, and the president just told you on live television that he plans to hit them “extremely hard.”
The bottom line
The rally you watched this week was built on three pillars: a quarterly options roll that fires mechanically regardless of fundamentals, pension funds that buy equities because their allocation spreadsheets demand it, and CTAs covering the most extreme short position in five years after a ceasefire headline that Iran denied within hours.
None of those forces repeat next week. The JHEQX collar is set until June. Pension rebalancing is done. CTA covering will only continue if the index sustains above current levels, and the dealer ceiling at 6,865 caps the upside.
What does repeat is the pattern of fabricated diplomacy followed by denial. Trump claims progress. Iran denies it. Suspicious trades precede the announcements. Markets whipsaw. And the war grinds forward.
Tonight’s speech removed the ambiguity. The president is not winding down. He is finishing. “Very fast.” Over the “next two to three weeks.” With the option to strike their oil.
Good Friday creates the perfect window. No equity trading. No liquidity. No price discovery. The April 6 deadline arrives while markets sleep.
The passive entities that bought this week don’t have opinions about war. They had quarterly mandates and mechanical triggers. Those mandates are now fulfilled. Those triggers have been pulled.
What remains is a market 6% below its highs, priced for peace, heading into an Easter weekend where the most likely outcomes range from escalation to invasion. Our models show an unnerving propensity for S&P 6,120-6,180 and a broad index decline into official correction territory.
If you found this analysis valuable, share it with someone who needs to see it before Thursday’s close. This is a companion piece to “The Perfect Storm No One Priced,” published March 2026.
I hate ceasefires
W biggun