

The Perfect Storm No One Priced
Every bubble has a pin. This one has a dozen.

Monday, March 2nd, 2026
On February 8, 2026, the President of the United States posted this on Truth Social:
“Record Stock Market, and National Security, driven by our Great TARIFFS. I am predicting 100,000 on the DOW by the end of my Term. REMEMBER, TRUMP WAS RIGHT ABOUT EVERYTHING!”
Twenty days later, US and Israeli fighter jets launched a decapitation strike on Tehran. Ayatollah Ali Khamenei, the 86-year-old Supreme Leader of Iran, was killed alongside members of his family. Before his body was cold, the IRGC launched hundreds of ballistic missiles and drones at every US military installation in the Middle East. Dubai International Airport, the busiest in the world, was damaged and shut down. The Burj Al Arab was hit. Jebel Ali Port caught fire. Bahrain, Qatar, Kuwait, Jordan, Saudi Arabia, and the UAE were struck simultaneously. Six US service members were killed. The Strait of Hormuz was closed to shipping. Over 200 freight ships are stalled behind it.
The S&P 500 closed at 6,910 on February 28, hours before the strikes began. For the first time in modern history, the index’s earnings yield have fallen below the risk-free rate on a 10-year Treasury. You are being paid more to own government bonds than to own every company in America. The last two times this inversion occurred were 2000 and 2007. You know what happened next.
Monday arrived. Markets gapped down, then staged one of the most reckless buy-the-dip rallies in recent memory. The S&P clawed back from -1.2% to close essentially flat at 6,882. Defense stocks surged. Energy rallied. And for roughly six hours, the market told itself a comforting story: that this was another geopolitical blip to be bought, just like every other one.
Then Tuesday happened. Overnight, Israel launched new strikes on Iran. Two drones hit the US Embassy in Riyadh. S&P futures plunged 2%. The Kospi crashed 7.24%. The Nikkei fell 3.06%. Europe’s Stoxx 600 dropped 2.7%. Brent crude pushed back above $77. European natural gas had already exploded 50% in two sessions. Gold reclaimed $5,400.
The repricing has begun. It is nowhere near finished.
This piece was being written before the first bomb fell. The valuations, the volatility regime, the AI circular financing, the credit stress, the political entanglement: all of it was already in place. Iran was the catalyst, but the bomb was already built. And when you see how these threads connect, you will understand why the most significant repricing event in a generation is only in its opening act.
I. The Most Expensive Market in 155 Years
The math is not debatable.
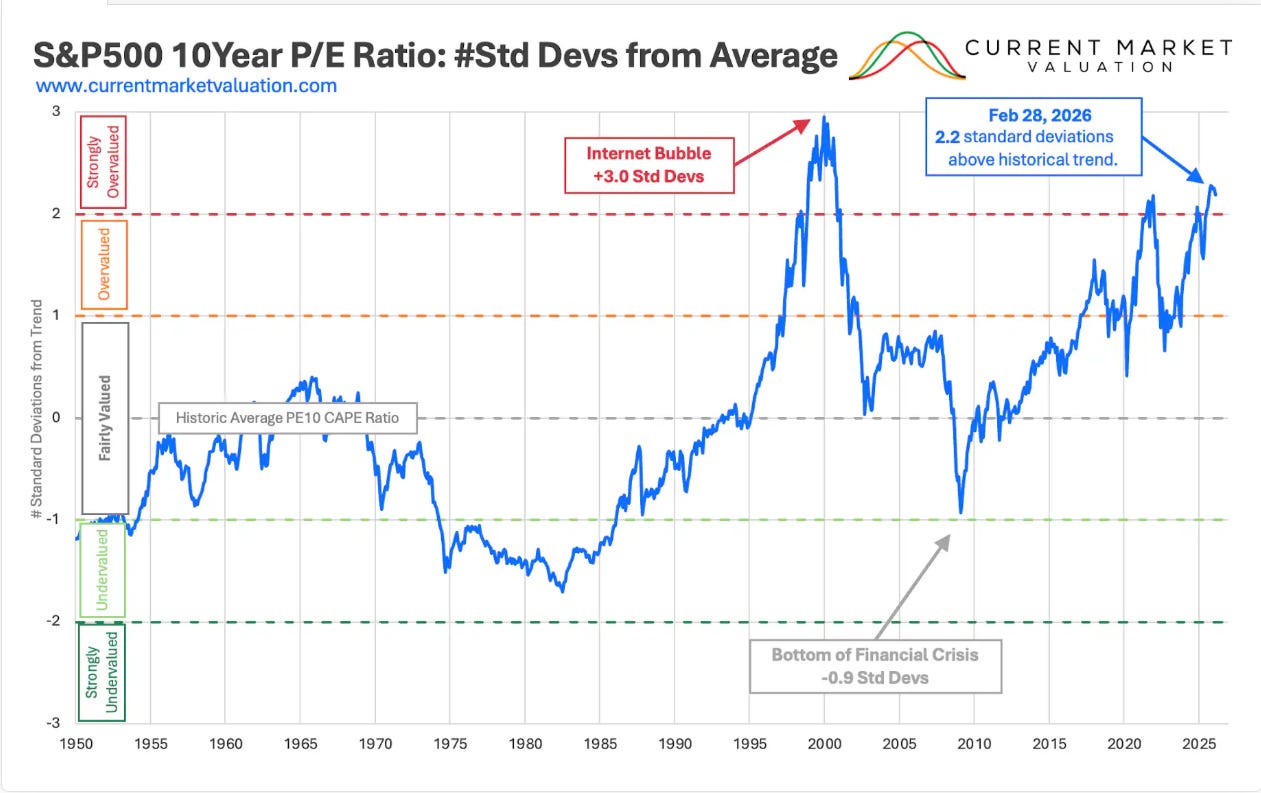
The Shiller CAPE ratio sits at approximately 40. In 155 years of data, this level has been exceeded exactly once: January 2000, when it briefly touched 44. The S&P subsequently fell 49%. The Nasdaq fell 78%. It took fifteen years to recover.
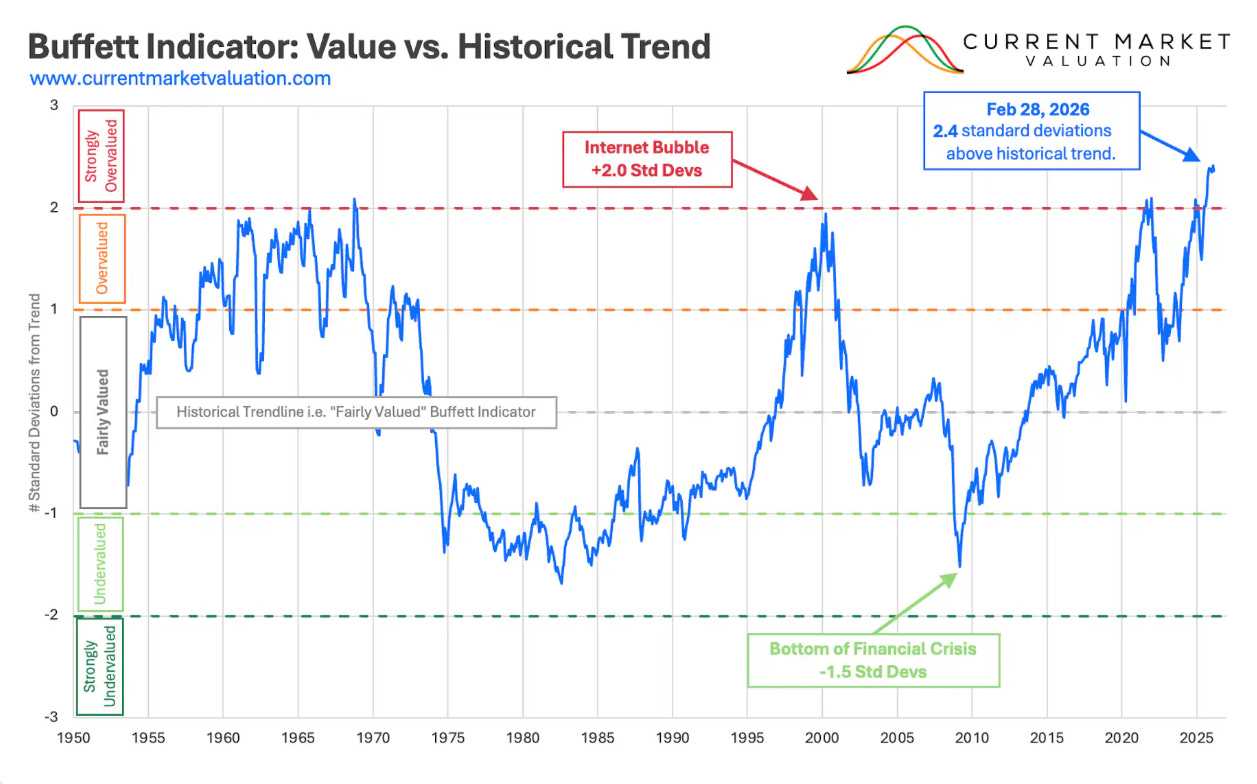
The Buffett Indicator (total market capitalization relative to GDP) has reached 218%. At the dot-com peak it was approximately 150%. Before 2008 it was approximately 110%. At current levels, the S&P 500 is projected to return negative 0.2% annualized over the next eight years.
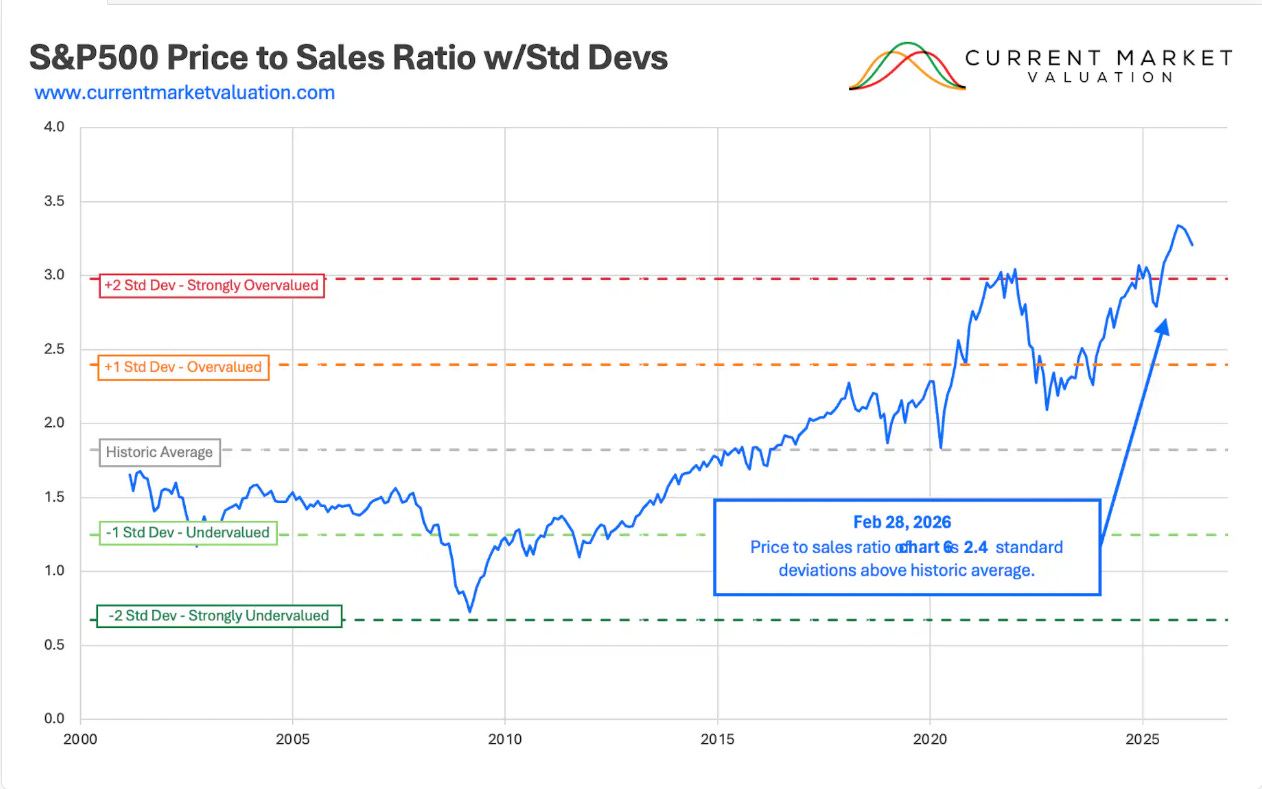
The S&P 500 price-to-sales ratio is 3.4x, above its dot-com peak of 2.87x. On this metric, the market has literally never been more expensive.
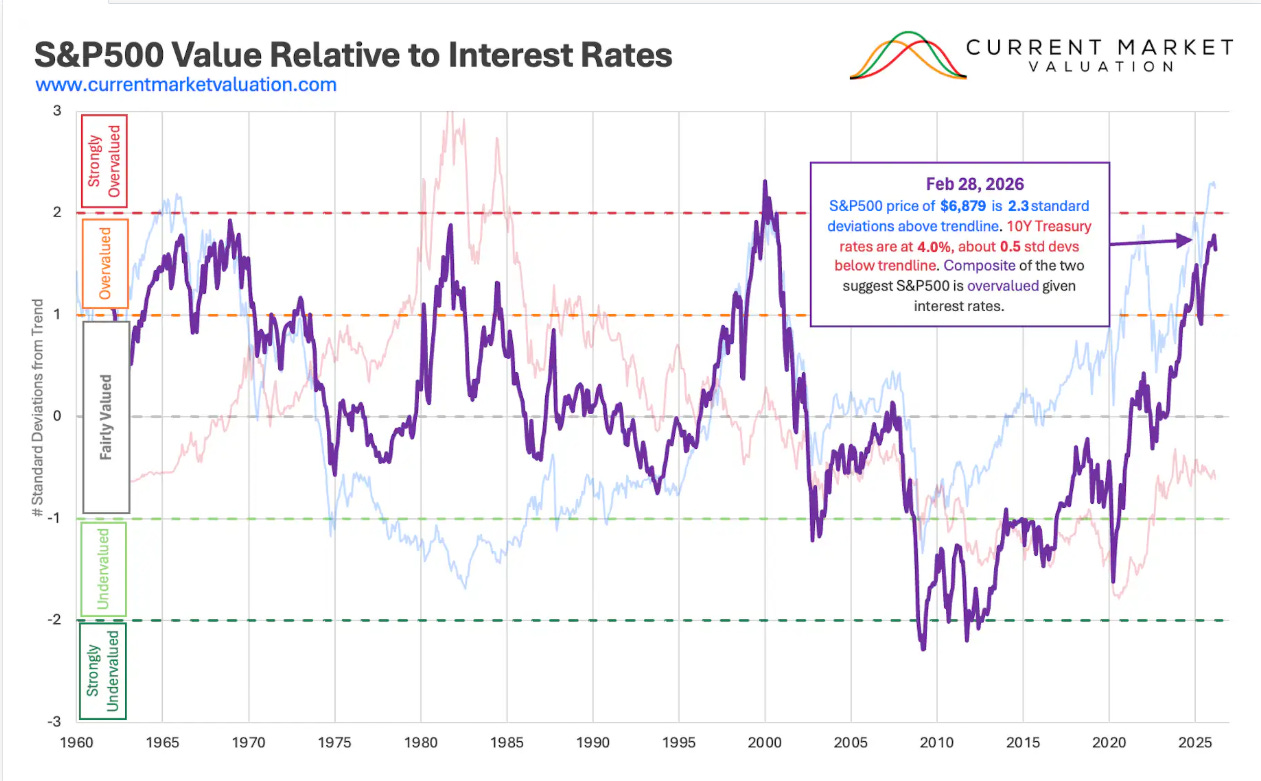
But here is the number that should stop you cold. The S&P 500’s earnings yield has fallen to approximately 3.4%. The 10-year Treasury yields 4.1%. The equity risk premium is negative. You are being compensated less for owning the entire American stock market than for lending money to the US government at a fixed rate for a decade.
Bloomberg’s composite valuation metric, averaging trailing P/E, forward P/E, CAPE, price-to-book, price-to-sales, EV/EBITDA, Q ratio, and market cap to GDP, has never been this high in over 100 years of data. Not in 1929. Not in 2000. Not ever.

Every single time valuations reached even half of current extremes, catastrophe followed. CAPE at 44 in 2000: S&P fell 49%. CAPE at 33 in 1929: fell 89%, took 25 years to recover. CAPE at 27 in 2007: fell 57%. Even the modest CAPE of approximately 18 before Black Monday 1987 preceded a 22.6% single-day Dow collapse.
We’re above all of them.
II. The Index Is a Lie
Goldman Sachs research shows the top 10 stocks now represent approximately 41% of the S&P 500’s weight, matching Great Depression levels. At the dot-com peak, the top 10 were 26%.
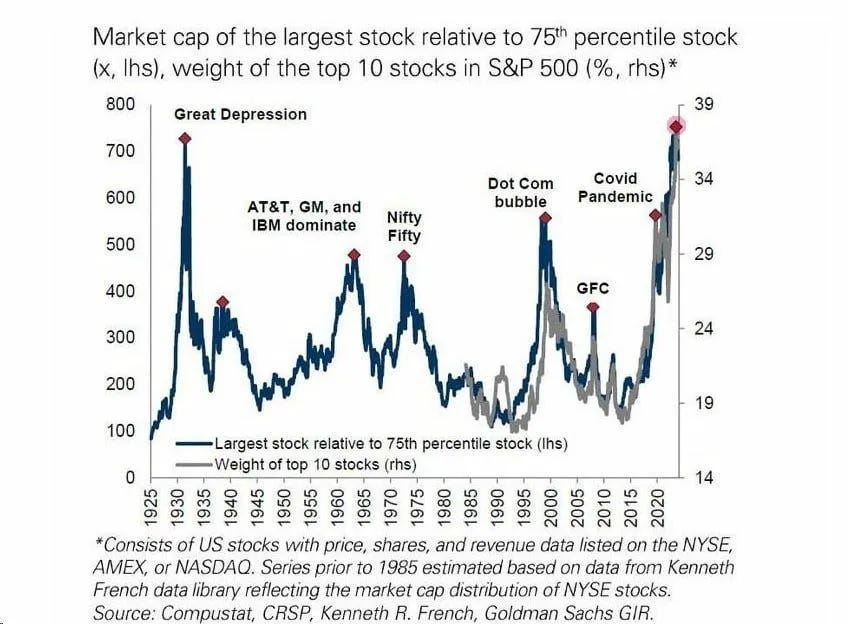
Those top 10 stocks command 41% of the index weight but contribute only 32% of its earnings. Their average forward P/E is around 30x. They’re carrying the index because passive flows don’t care about price.
Through late February, the Magnificent 7 are collectively down 6.3% YTD. Microsoft is down 17%. Amazon down nearly 14%. Yet eight of eleven S&P 500 sectors reached new all-time highs. More than 60% of S&P 500 constituents are beating the cap-weighted index. The market is flat while the majority of stocks are rallying, because the biggest names are bleeding. The market’s largest constituents are already in a stealth bear market while the index tells you everything is fine.
III. The Volatility Trap: Portfolio Insurance 2.0
The CBOE S&P 500 Constituent Volatility Index (VIXEQ) closed at 43.13 on February 23. The VIX was at roughly 20.6. The spread: approximately 22 to 24 points, ranking in the 99th percentile historically.
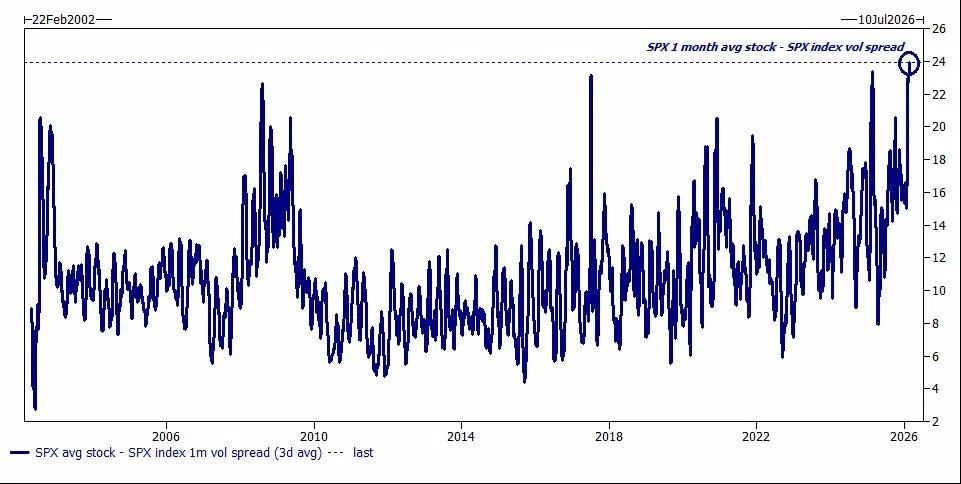
Individual stocks are experiencing violent moves. The index appears calm. When constituent-level volatility is high but inter-stock correlations are low, the diversification benefit mathematically suppresses index-level volatility. But when a macro catalyst hits, correlations spike to 1 simultaneously. The diversification benefit vanishes. And constituent-level volatility that was always there explodes through the index in a single move.
This is exactly what happened on Black Monday, October 19, 1987. The crash, a 20.4% single-day S&P 500 wipeout (22.6% on the Dow), was amplified by portfolio insurance, a hedging strategy where dealers’ algorithms automatically sold S&P 500 futures as stocks fell. Selling begat selling, and a correction became an avalanche.
Today’s version is zero-day-to-expiration (0DTE) options, now accounting for over 60% of all S&P 500 options volume. When investors buy 0DTE puts, dealers must hedge by shorting the underlying. In a falling market, this creates the identical pro-cyclical feedback loop. J.P. Morgan has warned that this dynamic could intensify an intraday 5% decline into a 25% plunge.
Monday’s action proved the mechanism works in both directions. The VIX spiked 18% intraday to 23.59 as dealers scrambled to hedge the overnight gap, then collapsed as the buy-the-dip crowd overwhelmed the selling pressure. Tuesday’s 2% futures drop is now testing the system again, this time with dealers already extended from Monday’s whipsaw. Each successive shock degrades the cushion.
The weekend decoupling risk that was theoretical is now empirical. 0DTE options expired Friday. The strikes began Saturday. There was no daily hedge in place. Dealers arrived Monday morning into a gap no existing position could cover, and had to sell into an already-falling market to rebalance. The gap was absorbed only because participants still operated on the assumption that this was a temporary disruption. If Tuesday’s escalation (embassy strikes, Trump projecting 4 to 5 weeks of operations, or “as long as it takes”) changes that belief, the next gap won’t be bought.
IV. The AI Bubble Is Eating Its Own Tail

The AI infrastructure buildout isn’t a capital investment cycle. It’s a circular financing scheme.
NVIDIA’s FY2025 10-K flagged outstanding inventory purchase and supply obligations at $30.8 billion. One year later, in the FY2026 10-K: $95.2 billion. Obligations roughly tripled while revenue grew 65%.
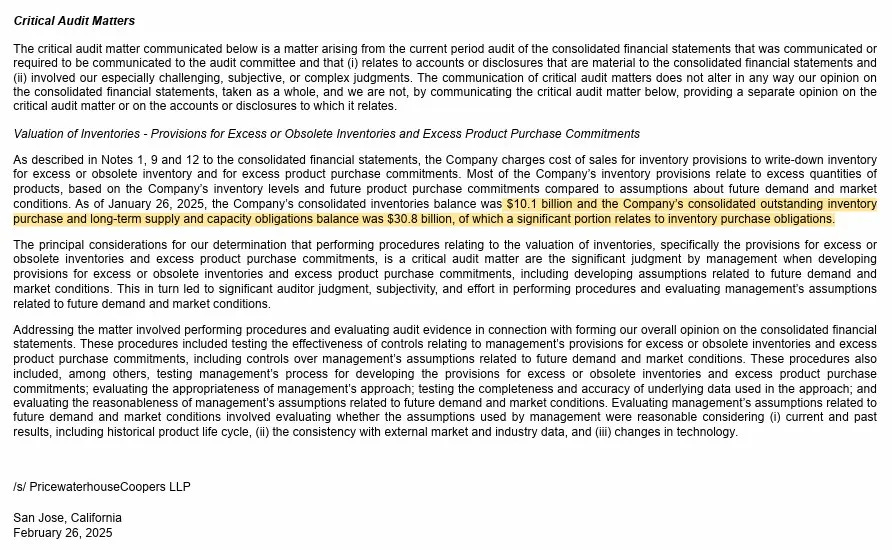
Supply commitments growing at 3x the rate of revenue means suppliers are less confident in the demand trajectory, not more. Michael Burry drew the parallel immediately: Cisco Systems in 2000. Cisco stock fell 89% and only briefly reclaimed its 2000 high in late 2025 before pulling back again.
But NVIDIA isn’t just a vendor with overextended supply chains. It’s financing its own customers. NVIDIA committed $6.3 billion to buy CoreWeave’s unsold compute capacity, invested $2 billion directly in CoreWeave, and guaranteed an $860 million lease. The vendor is bankrolling the buyer to purchase the vendor’s own product. Banks are distributing what amounts to AI-linked debt paper to private credit funds, pension funds, and insurance companies, the same way they distributed mortgage-backed securities before 2008.
CoreWeave just proved the fragility. Q4: GAAP loss of $0.89/share, missing by $0.40. Stock cratered 20%. Debt-to-equity: 894%. Negative levered free cash flow of $5.27 billion. Its loans are collateralized by GPUs with a 3 to 4 year useful life and no secondary market.
Oracle, which announced a $300 billion AI partnership with OpenAI, has fallen 60.5% from its September 2025 high. Negative free cash flow exceeding $10 billion. A securities fraud class action was filed February 3. CDS spreads have blown to 125 basis points, levels not seen since 2009.
In 2025, Amazon, Alphabet, Meta, Microsoft, and Oracle collectively issued $121 billion in bonds. Morgan Stanley estimates hyperscalers will borrow approximately $400 billion in 2026. Alphabet issued a 100-year century bond in February. The Magnificent 7 are no longer cash cows. They’re capital consumers, with combined capex forecast at $600 to $650 billion in 2026, roughly 2.2% of US GDP funneled into a single technology thesis.
V. Where Are We on the Timeline?
Every major crash follows a recognizable script. Overvaluation. Concentration. New instruments that suppress volatility. A narrative that “this time is different.” Then a catalyst.
Dot-com (1998 to 2000): The Nasdaq doubled in 18 months. Companies with no revenue commanded billion-dollar valuations. Cisco and Sun Microsystems were the “magnificent” names. Concentration surged. The median stock was already declining before the peak. Trigger: the Fed raised to 6.5% and internet companies couldn’t monetize. Nasdaq fell 78%.
2008 (2005 to 2008): Mortgage-backed securities, packaged by banks and distributed as “safe,” concealed enormous risk. Everyone got paid fees along the chain. Spreads were historically tight. Trigger: housing prices stopped rising, and instruments designed to “distribute” risk had concentrated it in ways nobody mapped. S&P fell 57%.
Black Monday 1987: The Dow tripled in five years. Rates rising, trade deficits ballooning. Portfolio insurance promised to protect against downside, instead amplified it. The Dow fell 22.6% in a single session.
Now: The S&P has approximately doubled since January 2020. AI valuations require decades of flawless execution. The rise of short-term and 0DTE options have created a feedback loop structurally identical to portfolio insurance. Mega-cap concentration exceeds the dot-com peak by 58%. Banks are distributing AI debt to yield-hungry investors while retaining little exposure. The equity risk premium is negative. The median stock is diverging from the index exactly as it did in late 1999. And a geopolitical catalyst of historic magnitude has just detonated.
We are somewhere between March 2000 and the week before Black Monday.
VI. Iran Is Not Iraq: The GCC Contagion Nobody Modeled
Every conflict in the Invesco dataset (Pearl Harbor, Korea, Desert Storm, 9/11, Iraq) shows the same pattern: markets dipped, then recovered. Carson Group’s Ryan Detrick noted Monday that across 40 major geopolitical events, the S&P lost just 0.9% in the first month but gained 3.4% over six months. Wells Fargo pointed out the S&P rose 16% and 14% after the first and second Gulf Wars.
The market’s instinct is to buy the dip. Wait.
There is exactly one negative post-conflict one-year return in the entire modern dataset: 9/11, negative 13.75%. It happened because the conflict struck a market that was already structurally vulnerable, with valuations elevated and a tech bubble deflating. Today’s valuations are higher than 2001 on every metric.
The Decapitation and What It Unleashed
On Saturday February 28, “Operation Epic Fury” killed Ayatollah Ali Khamenei, Iran’s Supreme Leader since 1989, alongside his daughter, son-in-law, and grandchildren. Reports indicate he had been battling prostate cancer and chose to remain in Tehran rather than flee to Moscow. Iranian state media initially denied his death, then confirmed it and reframed it: he chose to die for his people. In the same operation, 150 schoolgirls were reportedly killed in a southern Tehran school hit by a stray strike.
From the Western perspective: a successful decapitation. From the Iranian perspective: a martyrdom. In Shia Islam, the death of a leader in battle doesn’t weaken the movement. It galvanizes it. The entire theological architecture of Shia faith is built around sacrifice against overwhelming power. Khamenei’s death in an American airstrike, alongside his family, has created a religious obligation for every Shia Muslim on Earth: jihad against the great Satan.
This is not a war of territory. For Iran, this is now an existential religious conflict with no off-ramp short of total victory or total destruction. And Iran’s command structure, following the decapitation, is decentralized. Each regional command operates autonomously. Destroying Tehran does not disable the network. The American doctrine of “shock and awe,” cutting off the head so the body falls, does not work against an adversary whose military architecture was specifically designed to survive it.
36 Hours That Changed Everything
The IRGC launched the largest coordinated missile and drone barrage in Middle East history. The numbers through March 2:
UAE: 165 ballistic missiles, 541 drones. Three killed, 58 wounded. Dubai International Airport damaged and shut. Zayed International Airport hit. Jebel Ali Port caught fire. Strikes hit Dubai Marina and Palm Jumeirah, setting the Fairmont The Palm ablaze, damaging the Burj Al Arab. Al Dhafra Air Base targeted. The UAE recalled its ambassador to Israel. Both UAE stock exchanges were ordered closed March 2 and 3 by the Capital Market Authority.
Qatar: 65 missiles, 12 drones. 16 wounded. Al Udeid Air Base targeted. LNG facilities struck, halting all production at Ras Laffan, the world’s largest LNG export hub (77 million tonnes annual capacity). QatarEnergy preparing force majeure on shipments. Qatar Exchange plunged 4.29% Monday to an 8-month low.
Kuwait: 97 missiles, 283 drones. 32 wounded, one killed. Ali Al Salem Air Base struck. Kuwait International Airport hit. Shuaiba port attack produced the first US combat casualties.
Bahrain: 45 missiles, 9 drones. US Fifth Fleet headquarters hit directly. Bahrain’s 50%+ Shia population under Sunni monarchy creates acute internal unrest risk.
Saudi Arabia: Strikes hit Riyadh and eastern region. Ras Tanura refinery shut down after drone attack. Saudi Tadawul fell 2.67% Sunday, recovered to flat Monday on Aramco strength, then slipped again Tuesday.
Additional: Oil tankers hit off Oman. Britain’s Akrotiri base in Cyprus struck. Islamic Resistance Iraq claimed 23+ drone strikes on US assets.
Six US service members killed. Over 20,000 travelers stranded. Emirates suspended all operations indefinitely. Middle East airspace nearly empty for days. Explosions echoed through Doha, Manama, and Dubai for a fourth consecutive day on Tuesday. The IRGC stated operations will continue “until the enemy is decisively defeated.” Two drones struck the US Embassy in Riyadh on Tuesday, a dramatic escalation. Trump projected the campaign lasting 4 to 5 weeks.
Why the GCC Is the Lynchpin
The GCC nations are not just oil producers. They are the recycling mechanism of the American financial system. They sell oil for dollars, then invest those petrodollars in US Treasuries, equities, real estate, and AI infrastructure. GCC sovereign wealth funds (Abu Dhabi Investment Authority, Mubadala, Saudi Arabia’s Public Investment Fund, Qatar Investment Authority, Kuwait Investment Authority) collectively manage trillions with heavy US allocations. Investment flows from the UAE, Saudi Arabia, and Kuwait into US financial markets have exploded since 2012. The UAE was positioning itself as a major AI data center hub with cheap, abundant energy. An Amazon data center in the UAE was literally hit in the strikes.
If the GCC can’t sell oil (Strait of Hormuz closed), they can’t generate the dollars they recycle into American markets. If they’re spending reserves on defense, those reserves aren’t flowing into the S&P 500 nor investing into hyper-scaler data-center glut. If sovereign wealth funds need to liquidate US positions to fund war costs and reconstruction, they become sellers of the assets propping up the index. This is the transmission mechanism nobody on Wall Street is modeling: the Iran conflict doesn’t just raise oil prices. It cuts off one of the largest and most consistent sources of foreign capital flowing into US equities and AI investments.
And the GCC’s existence depends on three things the conflict threatens simultaneously: oil exports, food imports (80% of food arrives by sea through the Strait), and desalinated water (60% of GCC water supply). Dubai’s water stress ratio is 17,000%, meaning it uses 170 times more water than its environment naturally produces. Bahrain: 3,945%. Saudi Arabia: 883%. A single $50,000 Shahed drone can destroy a desalination plant. If a strike wiped out the primary facility serving Riyadh (10 million people), the city would run out of water in approximately two weeks. Ninety percent of Dubai’s population are foreign expatriates. Wealthy residents were reportedly offering $250,000 for a seat on any departing aircraft.
As CSIS warned: “Regime elements in Iran could decide that if the regime is on the verge of collapse, it will take the region down with it. A decision to more permanently block the Strait would be suicidal for Iran but impose enormous costs on the region’s energy producers.”
The GCC’s nightmare scenario, the one they spent decades of defense spending trying to prevent, has now materialized in a mere 36 hours.
The Asymmetric Math
Iran produces approximately 400 Shahed drones per day at $35,000 to $50,000 each. Estimated stockpile at conflict start: approximately 80,000. The US defends with THAAD interceptors ($12 million each), Patriot missiles ($3 to $4 million), and SM-3 missiles ($10+ million). The June 2025 strikes consumed approximately 14% of the US THAAD stockpile and an estimated 20% of SM-3 missiles. Two US military officials told the New York Times the current force can maintain the current level operations for only 7 to 10 days. We are now on Day 3. The IRGC has launched over 700 missiles and 1,000+ drones in 72 hours.
Every interceptor fired at a Shahed drone over Dubai is one that cannot be fired at a Chinese missile over the Taiwan Strait. CSIS war games concluded the US would run out of long-range precision munitions in less than one week in a Taiwan conflict. Brookings warned in February that US strikes on Iran “could create the perception, and possibly the reality, that the United States is preoccupied with the Middle East and less than ready to respond to a crisis in the Indo-Pacific.” TSMC manufactures approximately 90% of the world’s most advanced semiconductors. Bloomberg Economics estimates a US-China war over Taiwan would cost $10.6 trillion in year one.
The historical parallel is damning. After 9/11, the United States spent two decades consumed by Middle Eastern conflicts. During that exact period, China experienced its fastest economic growth and most dramatic rise in global influence, largely unopposed. A prolonged Iran engagement offers Beijing the same strategic window. China doesn’t need to invade Taiwan tomorrow. It needs the United States to be too depleted, too distracted, and too overextended to credibly deter the possibility.
VII. The Oil Shock and the Birth of a Commodity Supercycle
The Strait of Hormuz is operationally closed. The IRGC transmitted VHF warnings that “no ship is allowed to pass.” Tanker traffic has dropped 70 to 80%. At least 5 tankers have been damaged, 2 crew killed. Over 200 ships are stranded, including approximately 40 VLCCs. Every major shipping line, Maersk, MSC, Hapag-Lloyd, CMA CGM, has suspended transits. Marine war risk insurance has been cancelled by major underwriters. The IRGC is deploying electronic warfare (GPS disruption) in the strait.
Monday’s oil reaction was large but, as CIBC’s Rebecca Babin noted, “extremely measured” relative to the disruption. WTI settled at $71.23 (+6.28%) after touching $74.99 intraday. Brent settled at $77.74 (+6.68%), briefly spiking 13% to $82.37. By Tuesday, crude was trading in the $72 to $77 range. US gasoline averaged $2.99/gallon, up just 5 cents.
The restraint reflects a market still pricing for a short disruption. Barclays warns Brent could reach $100 if security spirals. UBS and JPMorgan model a sustained disruption above $120. If the Strait remains closed beyond three weeks, JPMorgan warns Gulf countries’ oil storage will be exhausted, forcing production shutdowns and repricing toward $150+. The White House is reviewing Strategic Petroleum Reserve options but has no plans to release from the SPR’s roughly 395 million barrels.
Japan depends on 75% of its oil from the Gulf. Prime Minister Takiichi said if the Strait closes, Japan runs out of oil in 8 to 9 months and the economy collapses. India depends on 60%. China on 40%. South Korea on 65%. This is not a regional crisis. This is a global energy emergency that will transmit through every economy on Earth simultaneously.
Natural gas has been even more violent. European TTF surged 45 to 54% Monday to approximately €47.65/MWh, then exploded another 40%+ Tuesday to €62.76/MWh, the highest since January 2023. Asian spot LNG spiked 131% from $10.80 to $25.00/MMBtu after the QatarEnergy production halt. Goldman Sachs projects TTF could reach €74/MWh, 130% above pre-crisis levels, if the Strait stays closed for one month.
This is not a temporary disruption. This is the opening salvo of a commodity supercycle.
The structural case was already overwhelming before a single bomb fell. Global mining exploration capex sits at approximately $11.2 billion, down 60% from the 2012 peak of $29.4 billion. New mine projects take 7 to 15 years to develop. You cannot flip a switch and produce copper, uranium, gold, or silver. The supply response to today’s prices won’t arrive until the 2030s.
Meanwhile, demand is compounding from multiple directions simultaneously. Copper demand is projected to grow 53% to 39 million MT by 2040. AI data centers use 10x as much copper as traditional facilities. EV sales are expected to triple to 45 million annually by 2030. Military rearmament across NATO, Japan, South Korea, and Australia is accelerating. And now the largest energy supply disruption since the 1970s is layered on top.
The metals tell the story. Gold hit $5,419 on Monday, within striking distance of its January all-time high of $5,589. Central banks purchased over 3,220 tonnes from 2022 to 2024, more than double the prior three-year total. Gold now accounts for a larger share of central bank reserves than US Treasuries for the first time since the mid-1990s. Goldman Sachs targets $5,400 year-end, JPMorgan targets $6,300, and both were set before the Iran escalation.
Silver spiked to $96.40 Monday before crashing 7% intraday as industrial demand fears offset safe-haven buying. The gold-to-silver ratio compressed to 57:1. Bank of America forecasts silver reaching $135 to $309/oz based on ratio compression analysis. The Silver Institute reports a fifth consecutive year of structural deficit in 2025 (approximately 95 million ounces), with cumulative shortfalls since 2021 exceeding 820 million ounces, equal to an entire year of global mining output. London silver lease rates had already spiked to 39% before the conflict, with Shanghai silver trading at a 16% premium over Western spot, indicating severe physical market stress.
Copper hit an all-time high of $13,387/mt in January, a level Goldman called a “breakout” that it then said wouldn’t last. But Goldman’s thesis assumed no major supply disruption. War in the Gulf, combined with years of mining underinvestment, changes the calculus entirely.
Wells Fargo’s John LaForge has argued the commodity bull supercycle began in March 2020, noting commodities trade at nearly 50-year lows relative to the S&P 500. Bank of America forecasts uranium at $105/lb (+43% YoY), a 60% crude oil rally as a contrarian trade, and calls energy the leading sector for 2026. JPMorgan Asset Management published a detailed paper arguing the clean technology transition is “igniting a new supercycle.”
And in the middle of all this, the infrastructure of commodity price discovery itself is breaking. On January 30, as silver surged past $121 per ounce, the CME simultaneously hiked margin requirements 36%, triggering a 30%+ crash in hours, the worst single-day decline since the Hunt Brothers’ liquidation in 1980. On February 25, CME halted all metals and natural gas futures trading for 90 minutes, citing “technical issues,” precisely 48 hours before March First Notice Day, when physical delivery demands would be filed. The precious metals paper market is over 200 times larger than the physical market. Banks profit by selling the same piece of metal multiple times through paper contracts. When buyers start demanding physical delivery instead of cash settlement, the entire structure shakes. That process is accelerating, driven by Chinese and Indian demand draining the vaults of the COMEX and the LBMA.
The dollar’s structural decline accelerates the trend. Its share of global FX reserves has dropped below 57% from 70%+ at the turn of the century. China has reduced Treasury holdings to approximately $700 billion from a peak above $1.3 trillion. Every dollar of dedollarization flows into hard assets: gold, silver, copper, oil. The Iran crisis doesn’t just spike energy prices. It validates the commodity thesis across the entire complex: metals for monetary hedging, energy for supply disruption, and industrial metals for the rearmament and energy transition spending that the crisis is now accelerating.
The dollar is trapped. The Trump administration has openly pursued a weak dollar policy. But an oil crisis can trigger the opposite: a flight-to-safety dollar surge that crushes emerging markets carrying $13 trillion in offshore dollar debt, hammers S&P 500 foreign earnings (40% of total), and creates a negative feedback loop between EM stress and US corporate fundamentals. Unless the dollar doesn’t rally. In April 2025, the dollar fell alongside equities while Treasury yields rose. The US was perceived not as a refuge but as a source of risk. If that dynamic repeats, it represents a fundamental break in the dollar’s safe-haven status and an acceleration of dedollarization into hard assets.
Welcome to Weimerica. Not Weimar Republic hyperinflation. At least not yet. But the structural dynamics are rhyming. Monetized government deficits exceeding $1 trillion per quarter. A central bank that cannot raise rates without detonating the economy and cannot cut without reigniting inflation. Political leadership explicitly tying market performance to its legitimacy. And a global monetary system in which the reserve currency’s share of trade settlement is declining for the first time in modern history, while the metals that served as money for millennia are being hoarded by the very institutions that are supposed to be stewards of fiat.
VIII. The Fed Trap and the Credit Cracks
The Fed sits at 3.50 to 3.75% with core PCE at 3% and GDP growth of just 1.4%. Monday’s ISM Manufacturing price index jumped to 70.5, reigniting inflation fears. The CME FedWatch tool showed less than 5% probability of a March cut.
An oil shock reignites inflation, making cuts impossible. But an economy entering recession with $150+ oil demands easing. This is the stagflationary trap of the 1970s. The last time it happened, the S&P fell 51.9% and Volcker raised rates to an eye-watering 21%.
On January 6, Trump posted his vision for monetary policy:
“I want my new Fed Chairman to lower Interest Rates if the Market is doing well... Inflation will take care of itself... Anybody that disagrees with me will never be the Fed Chairman!”
The Fed chair’s term expires in May. The job requirement is obedience, not independence.
Credit markets are already cracking beneath the surface. On February 27, every component of the KBW Bank Index closed red. Goldman Sachs: -7.4%. Morgan Stanley: -7.1%. Apollo: -8.9%. FS KKR Capital slashed its dividend 31% with non-accrual loans rising to 3.4%. Blue Owl Capital’s stock is down 60%+ after gating a $1.6 billion fund. Boaz Weinstein of Saba Capital: “I think we are in the super-early innings of the wheels coming off the car.”
Index-level credit spreads remain tight: investment grade at approximately 96 basis points, high yield at approximately 300 basis points. But the dispersion within credit mirrors equities. BB-rated spreads are tight. CCC-and-below are widening toward 20-year averages. Oracle’s CDS is at crisis-era levels. Private equity firms globally are sitting on approximately $4 trillion in unsold assets. The index shows nothing because the toxic paper is in the shadows. This is 2007 all over again.
Meanwhile, Microsoft Japan was raided by the Fair Trade Commission on February 25 over suspected antitrust violations related to Azure cloud bundling, part of a coordinated global regulatory assault spanning Japan, Brazil, the UK, and the EU. Regulatory tightening accelerates during periods of political populism and economic stress, adding another headwind to the mega-cap tech names holding the entire index together.
IX. The Political Powder Keg
The administration has fused its credibility to the stock market. Consider the timeline.
October 10, 2025: “Tariffs are having a huge positive impact on the Stock Market... If a Radical Left Court ruled against us... It would be 1929 all over again, a GREAT DEPRESSION!”
February 8, 2026: “I am predicting 100,000 on the DOW by the end of my Term.”
February 20, 2026: The Supreme Court strikes down the IEEPA tariff authority. Trump calls justices “FOOLS and LAPDOGS,” signs a 10% global tariff under Section 122 with a 150-day clock.
February 11, 2026: AG Pam Bondi, questioned about the Epstein investigation, deflected to the stock market. She cited the Dow at 50,000 and the benefits to retirement accounts. She was asked about one of the most consequential criminal investigations in modern history, and her answer was: look at your 401(k).
This creates an impossible paradox: the incentive to intervene and support markets is enormous, but the tools (rate cuts, stimulus, jawboning) are constrained by inflation above target, fiscal deficits exceeding $1 trillion per quarter, a Fed with limited ammunition, and a Supreme Court that just invalidated the primary trade tool.
Recall what happened the last time markets cracked. In April 2025, Trump’s “Liberation Day” tariffs caused the S&P to crash 10% in two days. Six trillion dollars evaporated. The President’s response, posted at 9:37 AM while the market was in freefall:
“THIS IS A GREAT TIME TO BUY!!! DJT”
When political leaders use market levels as proof of competence, the market becomes a political liability. And political liabilities, in periods of stress, get abandoned.
On April 30, 2025, when the market was falling, Trump posted:
“This is Biden’s Stock Market, not Trump’s... when the boom begins, it will be like no other. BE PATIENT!!!”
When it’s up, it’s his. When it’s down, it’s Biden’s. When it crashes, it’ll be the Supreme Court’s, or the Fed’s, or Iran’s. The one thing it will never be is a reflection of the structural risks that were building in plain sight while the political establishment pointed at the scoreboard and called it proof of genius.
The Index Is Starting to Learn
Gold knew. It was at $5,278 before the first bomb fell. By Monday it was at $5,419.
Credit knew. Blue Owl was gating. KKR’s fund slashed its dividend. Private credit defaults were doubling.
The shipping market knew. VLCC rates quadrupled this year. Frontline stopped transiting Hormuz weeks ago.
The dispersion between constituent and index volatility knew. It hit the 99th percentile historically.
The commodity complex knows. Oil is repricing. European gas has exploded 50% in two days. Silver lease rates were screaming physical shortage before a single missile launched. Copper hit $13,387. Uranium is accelerating. Central banks are hoarding gold at rates not seen in decades. The entire hard asset universe is telling you the same thing: the era of cheap commodities underwritten by stable supply chains, recycled petrodollars, and American military hegemony is ending.
The GCC knows now. Dubai International Airport is damaged and closed. The US Embassy in Riyadh has been hit by drones. 200 ships are stranded. QatarEnergy has halted LNG production. The sovereign wealth funds that recycled petrodollars into American equities and AI data centers are spending those reserves on missile defense and emergency infrastructure.
And the S&P 500 is starting to learn. Monday’s buy-the-dip rally held for exactly one session. Tuesday’s 2% futures plunge, with the Kospi crashing 7% and the Nikkei down 3%, is closer to the truth. But even Tuesday’s reaction assumes this ends quickly. The correlation chain says otherwise.
The Strait of Hormuz is closed. Oil is repricing. Higher oil reignites inflation. Inflation traps the Fed. A trapped Fed pressures credit. Tighter credit slows lending. Slower lending undermines the economy. A weaker economy collapses AI revenue assumptions, especially as GCC nations that were financing AI data centers are now under bombardment. Failed AI assumptions puncture the tech bubble. A tech bust collapses the names holding up the index. Collapsing leadership triggers the dispersion unwind, as constituent-level volatility floods into the index. Index-level volatility activates the 0DTE feedback loop. And a correction becomes a crash. Meanwhile, every munition spent in the Middle East widens the deterrence gap across the Pacific, making the semiconductor supply chain vulnerable in a way it has never been before.
The 1973 Yom Kippur War hit a market with a CAPE of approximately 20 and a Buffett Indicator under 80%. The combination of energy shock, monetary policy error, and fiscal profligacy produced a decade of negative real returns. The S&P fell 51.9%. Today’s CAPE is 40. The Buffett Indicator is 218%. Concentration matches the Great Depression. And the geopolitical catalyst in 1973 was an oil embargo by allied states choosing not to sell. Today it’s a direct military confrontation with a nation that has physically closed the chokepoint, is actively destroying the oil infrastructure on the other side, and has launched a sustained military campaign against every US installation in the region.
History doesn’t repeat, but the rhyme is deafening. The dot-com bubble had Cisco and Sun Microsystems. We have NVIDIA and CoreWeave. The 2008 crisis had mortgage-backed securities distributed to yield-hungry investors by banks taking fees. We have AI-linked debt distributed to private credit funds by banks taking fees. Black Monday had portfolio insurance. We have 0DTE options. The 1973 crash had an oil shock during a foreign war at extreme valuations. We have all of the above, simultaneously, at higher valuations than any of them.
The spring was wound. The hammer has fallen. And the market is only beginning to hear the sound.
Behind all of it: a political establishment that told the American public, repeatedly and in writing, that the stock market is the scoreboard. The Dow at 100,000 by end of term. The stock market as answer to Epstein questions. The market level as proof of tariff success. What happens when the scoreboard breaks?
Each risk, in isolation, was manageable. Together, they form the most dangerous confluence of market, monetary, geopolitical, and commodity stress since 1973, or maybe even 1929. And unlike 1973, the catalyst isn’t an embargo by allied states choosing not to sell oil. It’s a war. With a closed Strait. Burning airports. A dead Supreme Leader whose martyrdom has galvanized a religious movement. And a commodity supercycle igniting beneath an equity market priced for a world that no longer exists.
Position accordingly.
Sources: SEC filings (NVIDIA 10-K FY2025/FY2026, Oracle 10-K, CoreWeave S-1), Bloomberg, CurrentMarketValuations.com, Goldman Sachs Global Investment Research, S&P Global, CBOE, JPMorgan, Morgan Stanley, Bank of America, Wells Fargo, UBS, Barclays, CNBC, CNN, NPR, Reuters, Al Jazeera, The National, ZAWYA, Khaleej Times, RTE, Investing.com, gCaptain, Euronews, World Oil, CSIS, Brookings Institution, AEI, Silver Institute, World Gold Council, CME Group, Advisor Perspectives, Hartford Funds, Invesco, FDD Long War Journal, Breaking Defense, the New York Times, Wall Street Journal, Truth Social, Wikipedia (2026 Iran conflict).
I love the part about Nvidia funding their own customers, not to mention that all of these companies are now stretching the listed useful life of the gpus to 7 years. Using trick accounting that relies on these gpus to last 7 years to justify their current price.